
A clear presentation does not need every figure to look equivalent; it needs to explain which decision each informs.
Start with the meeting’s questions
A marketing director prepares a board update with LinkedIn activity, campaign results and press mentions, but the first slide only adds together large figures. Before choosing charts, identify what the audience needs to decide: retain an investment, review a message or investigate a market. Match each question with the relevant evidence. One figure may describe distribution, another interaction and another commercial response; displaying them together does not make them measures of the same effect.
Make period, source and scope visible
Check what each indicator covers and where it comes from. A period change, an account no longer supplying information or a different definition can explain an apparent difference. If two sources cannot be reconciled, keep them separate and explain what needs review. Avoid filling a table with a similar-looking number simply to maintain symmetry. The recipient needs to recognize what can be compared with the previous period and what requires a different question before drawing conclusions.
The context behind a number
Before interpreting a metric, agree on what it represents and the conditions behind it.
What is counted and what is excluded.
Prepare a shared reading in Wiwo.MetriQ
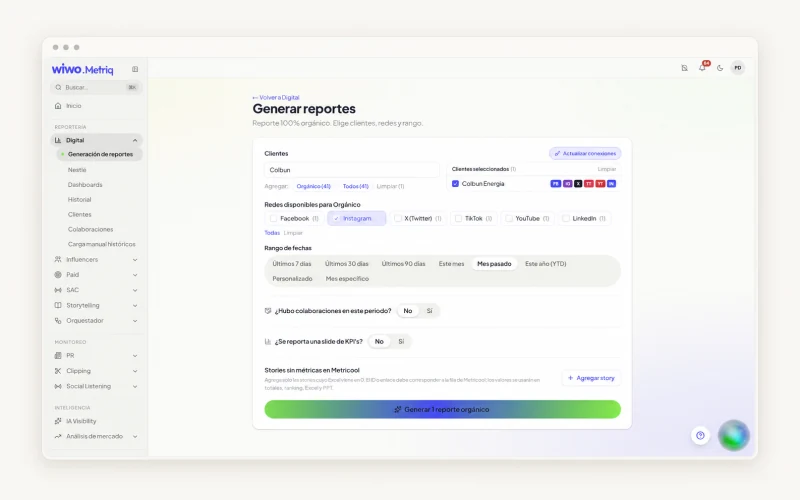
Wiwo.MetriQ brings together analysis of connected accounts, advertising, LinkedIn, press and other areas within each module’s available scope. Review brands, periods and content, and prepare dashboards or exports according to configuration. This organization makes it easier to return to evidence behind a presentation. It does not turn different indicators into a common measure or missing data into zero. Bring a typical report to the demo and check which source and period would accompany each reading your team needs to present.
End each reading with a pending decision
After the indicator, write the team’s proposed interpretation and what needs checking before acting. For example, a piece of content may generate useful questions not yet connected to commercial opportunities. The next conversation might investigate those enquiries rather than declare that they already produced sales. Distinguish observation, interpretation and next step so the board can discuss each separately. When a definition or source changes, preserve a clear note in the following report. Analytical continuity also depends on remembering how the comparison was constructed.
Frequently asked questions
Can several channels appear in the same dashboard?
Yes. Keep their sources, periods and definitions visible, avoiding a sum that implies equivalence or no duplication without checking it.
What if an indicator is unavailable this month?
Identify the gap and its known reason. Do not replace it with zero or another metric without explanation; review how the absence affects comparison and the proposed decision.